Key points
– Australia ranked as having one of the lowest rates of disposable income growth per capita amongst OECD countries in mid-2023.
– An increasing income tax burden and mortgage repayments have weighed on income growth, despite solid wages and salaries.
– But, household balance sheets in Australia look stronger compared to incomes. Household wealth increased in 2023, as home prices rose.
– However, growth in household wealth will decline in 2024 as home prices are expected to fall. Household incomes will also be under pressure as earnings growth slows from a softening labour market.
– As a result, high household wealth holdings will not be enough to offset a challenging environment for households in 2024, despite some easing in cost-of-living challenges.

Introduction
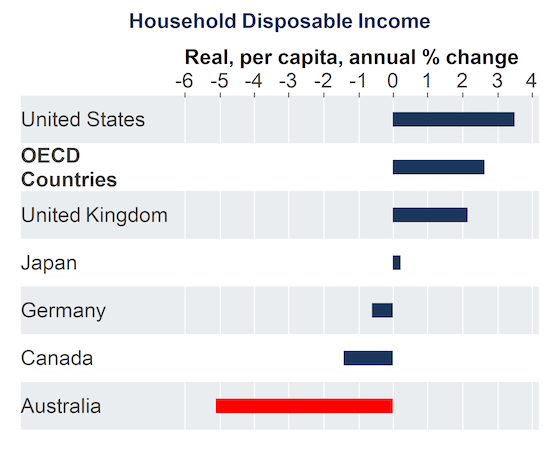
Household income data from the OECD showed that Australia had one of the lowest rates of annual real household disposable income per person compared to its OECD peers (see the chart below). Over the year to June, Australia’s real per capita household disposable income was down by 5.1%, compared to a 2.6% rise across OECD countries.

Source: AMP, Macrobond
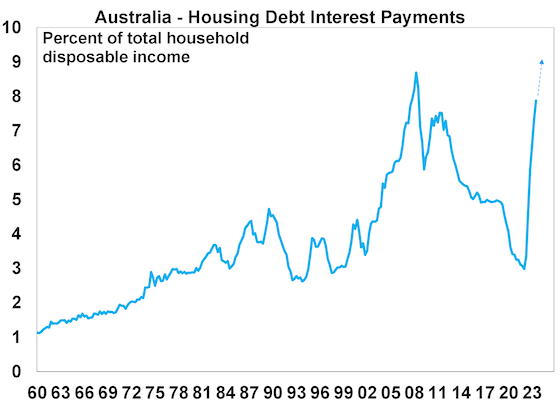
This occurred despite very healthy labour market conditions in Australia which saw employment growth running above 3% per annum all year, the unemployment rate remaining below 3.9% and underemployment continuing to be low, all of which boosted wages growth. Despite this positive earnings backdrop, the income tax burden increased in 2023 as households have been moving into higher income tax brackets (otherwise known as “bracket creep”) as well as the end of income tax concessions. Mortgage interest repayments are also an increasing drag on incomes (see the chart below) as the cash rate has been increased by 425 basis points since May 2022. Australia’s very high population growth in 2023 (running at 2.4% over the year to June 2023) also masked a fall in household disposable income growth per person, relative to other OECD countries.

Source: ABS, AMP
Just looking at household income accounts does not show everything about the position of households. In a country like Australia where home ownership rates are high (66% of Australian households own their home with or without a mortgage), looking at household wealth is also important.
Household wealth in Australia
The Australian Bureau of Statistics estimates the value of a household’s assets, liabilities and therefore wealth. Net worth or wealth is calculated as a household’s total assets minus its liabilities. Total wealth is close to 11 times the size of household disposable income (or 1083%) and net wealth is 896% of income. The latest data for the year to June 2023 showed a slight fall in wealth as a share of income, after it reached a record high in 2022 – see the chart below. Non-financial wealth is worth 647% of income, larger than financial wealth at 436% and well surpassing household debt, which is 187% of income.

Source: RBA, AMP
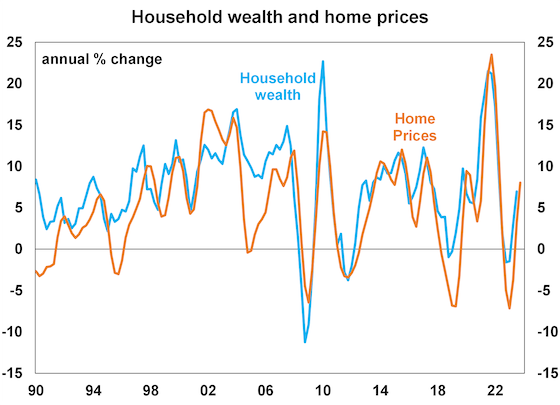
Around 70% of Australian household wealth is tied to the value of homes (which is made up of land and dwellings) and moves closely in line with home prices (see the chart below). Household wealth rose throughout 2023, in line with solid growth in home prices.

Source: ABS, AMP
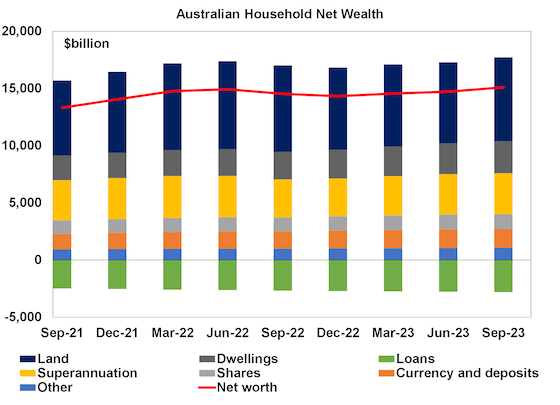
Other components of household wealth are shown in the chart below. Assets include superannuation, shares and currency and deposits. Loans which are mostly for housing are the source of household liabilities.

Source: ABS, AMP
How does household wealth compare around the world?
Australian household wealth as a share of household disposable income is at the top end of its OECD peers (see the chart below).

Source: OECD, AMP
High holdings of wealth could be considered a source of support for households, especially against record levels of household debt in Australia. This is a concept known as the “wealth effect”. When household wealth increases, households feel more secure with their financial position and household savings tend to decrease which lifts consumer spending. When wealth decreases, households feel less secure which leads to an increase in savings and decline in spending. However, this relationship does not always work. Most recently in the pandemic, household wealth rose in 2021/22 alongside the lift in home prices but the savings ratio also surged thanks to government-driven stimulus cheques. Since then, the household savings ratio has been falling but growth in total consumer spending has been low. We expect that the household savings rate will continue to fall in 2024 as it normalises after the pandemic but growth in consumer spending will still be low.
Implications for investors
Households dealt with a cost-of-living challenge in 2023 because of high inflation and rising interest rates. Inflation is expected to slow in 2024 and we expect the RBA to start cutting interest rates by mid-year which should ease the repayment burden for households with a mortgage, as mortgage interest repayments as a share of income are rising to a record high (see the chart below).

Source: ABS, AMP
So, while cost-of-living issues should improve for consumers, household wealth will come under pressure in 2024 as we expect home prices will decline by 3-5%. This is likely to occur alongside a slowing in household incomes as the labour market weakens and the unemployment rate increases. This environment is expected to be negative for consumer spending and GDP growth. We see GDP growth rising by 1.2% over the year to June 2024, below the RBA’s forecast of 1.8% and anticipate the unemployment rate to increase to 4.5% by mid-year. This should see the RBA cutting interest rates by June and we expect a total of 3 rate cuts in 2024.
Wealth inequality between households is also an issue in Australia. The top 20% of households (by income quintile) owned 63% of total household wealth in 2019-20 but the bottom income quintile (the bottom 20%) owned less than 1% of all household wealth. In Australia there is also increasing generational wealth gap, with wealth across older households increasing significantly over recent decades but this has not been the case for younger Australians. There are numerous government policies that could address these issues of wealth inequality including improving the housing affordability issue (through lifting housing supply and/or looking at the favourable treatment of housing investment) and doing a tax review (looking at broadening the GST and examining the merits of a wealth or death tax) which could help the wealth inequality issue.
Source: AMP January 2024
Important:
This information is provided by AMP Life Limited. It is general information only and hasn’t taken your circumstances into account. It’s important to consider your particular circumstances and the relevant Product Disclosure Statement or Terms and Conditions, available by calling PH 07 55931215 , before deciding what’s right for you.
All information in this article is subject to change without notice. Although the information is from sources considered reliable, AMP and our company do not guarantee that it is accurate or complete. You should not rely upon it and should seek professional advice before making any financial decision. Except where liability under any statute cannot be excluded, AMP and our company do not accept any liability for any resulting loss or damage of the reader or any other person. Any links have been provided for information purposes only and will take you to external websites. Note: Our company does not endorse and is not responsible for the accuracy of the contents/information contained within the linked site(s) accessible from this page.
